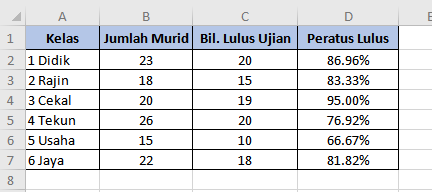
Unlocking Insights: How to Calculate Average Percentages
Have you ever found yourself juggling multiple percentages, trying to make sense of the bigger picture? Maybe you're tracking your savings growth across different accounts, each with its own interest rate. Or perhaps you're a student aiming to understand your overall academic performance across various subjects. In a world brimming with data, understanding how to calculate and interpret average percentages is a valuable skill.
At its core, an average percentage provides a consolidated view of proportional data. Instead of grappling with a jumble of individual percentages, you get a single, meaningful figure that represents the central tendency of the data set. This simplification allows for easier comparison and analysis, enabling you to make more informed decisions.
The concept of averaging percentages has been around for centuries, finding its roots in mathematics and statistics. As data analysis gained prominence in various fields, so did the importance of understanding and applying average percentages. From finance and economics to education and healthcare, this statistical tool plays a crucial role in interpreting trends, evaluating performance, and making predictions.
However, there's a common pitfall when dealing with average percentages – simply averaging them directly can lead to misleading results, especially when the underlying values or sample sizes differ significantly. This is where a nuanced understanding of calculating weighted averages comes into play, ensuring accuracy and meaningful insights.
Let's delve into a simple example to illustrate this point. Imagine you're invested in two stocks. Stock A has a return of 10% on an investment of $1,000, while Stock B yields a 5% return on a larger investment of $5,000. Simply averaging 10% and 5% to get 7.5% wouldn't reflect the actual overall return on your total investment. Instead, you need to calculate a weighted average, taking into account the different investment amounts to get a more accurate picture of your portfolio's performance.
Advantages and Disadvantages of Average Percentages
| Advantages | Disadvantages |
|---|---|
| Simplifies complex data | Potential for misinterpretation if not calculated correctly |
| Facilitates easy comparison | May not reflect individual data points accurately |
| Provides a concise overview of trends | Sensitive to outliers |
While understanding the calculation is key, let's not overlook the importance of using average percentages responsibly. They should be seen as one tool among many in your analytical toolbox. Always consider the context, the source of your data, and potential biases before drawing conclusions solely based on average percentages.
In conclusion, the ability to calculate and interpret average percentages is an invaluable skill in today's data-driven world. Whether you're a student, a professional, or simply navigating everyday life, this statistical tool empowers you to make sense of numbers, identify patterns, and make informed decisions. So, the next time you encounter a series of percentages, don't shy away – embrace the power of averaging and unlock a deeper understanding of the information at hand.
The unexpected eloquence of manchas en las palmas de las manos
Unlocking cheap flights within the us your ultimate guide
Mastering your mind body image a holistic approach

cara kira purata peratus | Innovate Stamford Now

cara kira purata peratus | Innovate Stamford Now

cara kira purata peratus | Innovate Stamford Now

cara kira purata peratus | Innovate Stamford Now

cara kira purata peratus | Innovate Stamford Now

cara kira purata peratus | Innovate Stamford Now

cara kira purata peratus | Innovate Stamford Now

cara kira purata peratus | Innovate Stamford Now

cara kira purata peratus | Innovate Stamford Now

cara kira purata peratus | Innovate Stamford Now

cara kira purata peratus | Innovate Stamford Now