Unlocking the Secrets of Three-Phase Power: A Visual Guide to Phasor Diagrams
Ever wondered how electricity gets from power plants to your home? The answer often lies in the magic of three-phase power. And the key to understanding this powerful system? Three-phase power phasor diagrams. These visual representations might seem daunting at first, but they're surprisingly intuitive tools for unraveling the complexities of electrical distribution.
Three-phase power, unlike single-phase power commonly used in homes, utilizes three alternating currents that are offset in time. This clever arrangement offers significant advantages in terms of efficiency and power delivery. Phasor diagrams provide a graphical snapshot of these three currents, illustrating their magnitude and phase relationship. Think of them as a map, guiding you through the intricate landscape of three-phase power.
The concept of representing alternating currents with vectors, known as phasors, emerged alongside the development of alternating current systems in the late 19th century. Charles Proteus Steinmetz, a brilliant mathematician and electrical engineer, is credited with popularizing the use of phasor diagrams in electrical engineering. These diagrams became essential tools for analyzing and designing AC circuits, including the burgeoning field of three-phase power systems.
The importance of three-phase power phasor diagrams cannot be overstated. They simplify the analysis of complex circuits, allowing engineers to calculate voltages, currents, and power in a balanced or unbalanced three-phase system. Without them, navigating the intricacies of phase angles and voltage relationships would be considerably more challenging. A common issue related to understanding these diagrams is grasping the concept of phase sequence (the order in which the phases reach their peak values), which is crucial for proper motor operation, among other things.
A three-phase phasor diagram typically depicts three vectors, each representing one of the phases (commonly labeled A, B, and C). These vectors are separated by 120 degrees, reflecting the time offset between the currents. The length of each vector represents the magnitude of the current or voltage in that phase. The diagrams can be used to visualize various three-phase configurations, including star (wye) and delta connections.
Benefits of Three-Phase Power Phasor Diagrams:
1. Simplified Analysis: They provide a visual representation of complex mathematical relationships, making it easier to understand and analyze three-phase circuits.
2. Problem Solving: They help identify faults and imbalances in three-phase systems by visually highlighting deviations from the expected phasor relationships.
3. Design and Optimization: They are essential tools for designing and optimizing three-phase power systems, enabling engineers to predict system behavior and ensure efficient power delivery.
Best Practices for Implementing Phasor Diagram Analysis:
1. Understand the basics of vectors and complex numbers.
2. Clearly label each phasor with its corresponding phase and magnitude.
3. Maintain consistent scale and orientation for all phasors in a diagram.
4. Use software tools for complex calculations and visualizations.
5. Cross-verify results with other analysis methods to ensure accuracy.
Advantages and Disadvantages of Using Phasor Diagrams
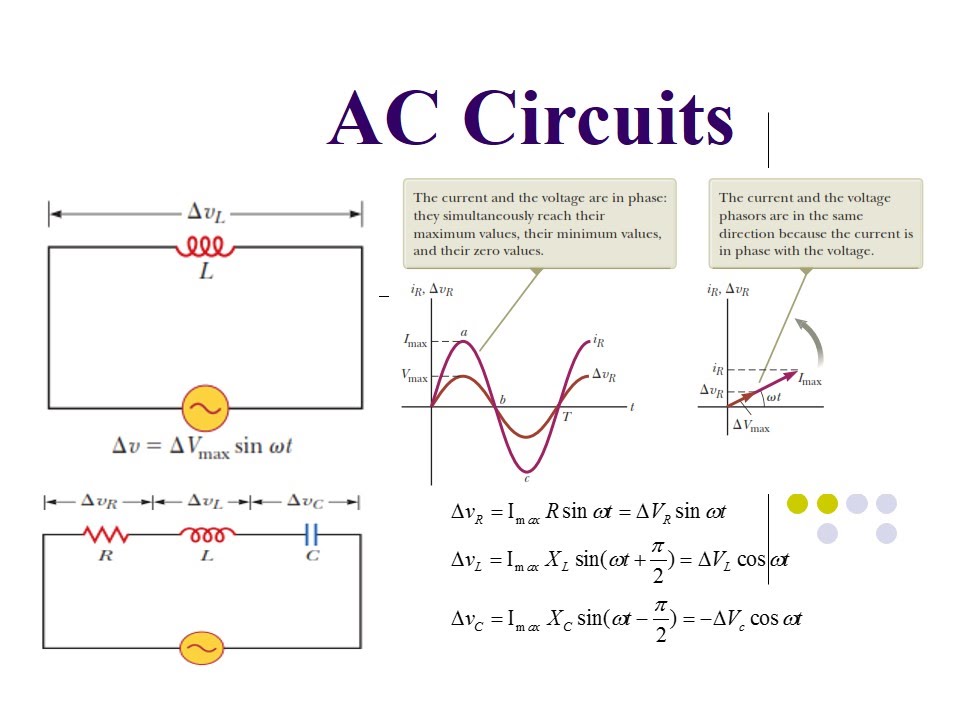
While invaluable, phasor diagrams do have limitations, particularly when dealing with complex, non-sinusoidal waveforms.
Frequently Asked Questions
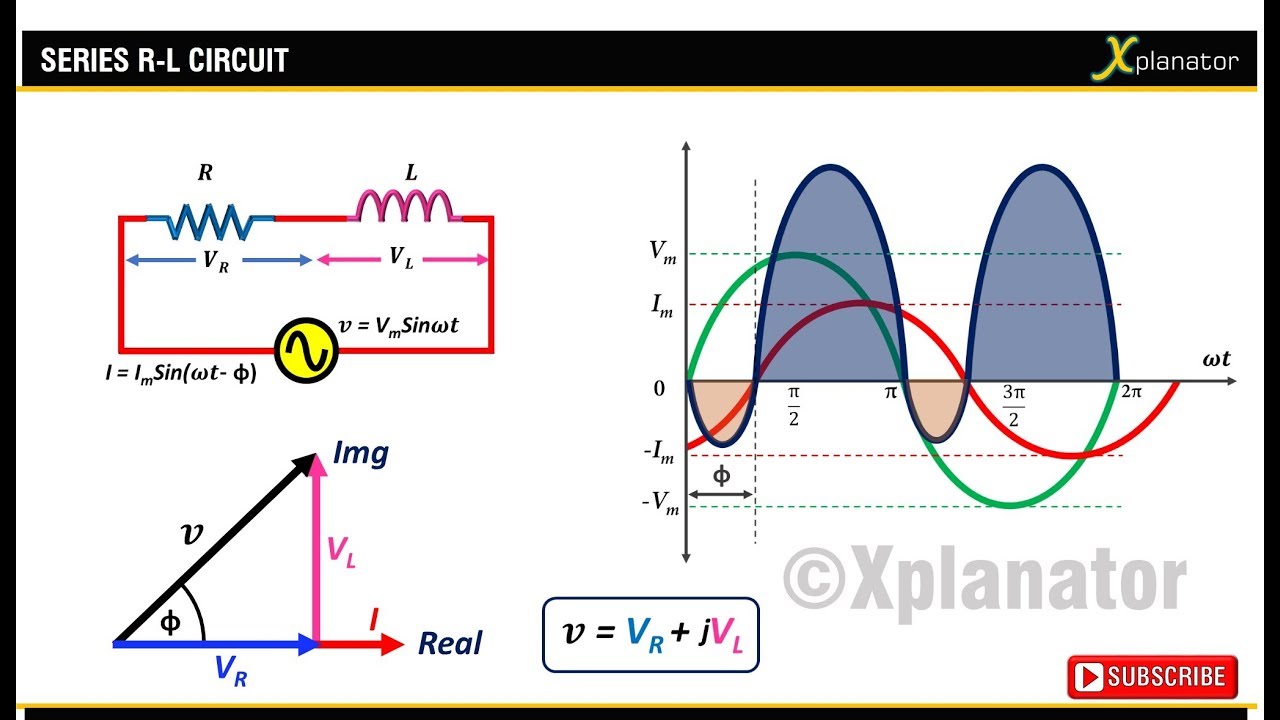
1. What is a phasor? A phasor is a rotating vector representing a sinusoidal quantity.
2. Why are phasor diagrams used in three-phase power? They simplify analysis of three-phase systems.
3. What is phase sequence? The order in which phases reach their peak.
4. What is the difference between star and delta connection? Different ways of connecting three-phase loads.
5. How do you calculate power using phasor diagrams? Using specific formulas involving voltage and current phasors.
6. What are the limitations of phasor diagrams? They are primarily applicable to sinusoidal waveforms.
7. What software can be used to create phasor diagrams? Various electrical engineering software packages.
8. Where can I learn more about three-phase power systems? Textbooks, online resources, and university courses.
Tips and Tricks
Practice drawing phasor diagrams for different scenarios to solidify your understanding. Use online simulators to visualize the dynamic behavior of three-phase systems. Explore advanced concepts like symmetrical components for fault analysis.
In conclusion, three-phase power phasor diagrams are indispensable tools for anyone working with electrical power systems. They provide a visual gateway to understanding complex relationships between voltage, current, and power in three-phase circuits. From designing efficient power distribution networks to troubleshooting faults, these diagrams empower engineers and technicians to harness the full potential of three-phase power. By mastering the art of phasor diagram interpretation, you unlock a deeper understanding of the electrical world that powers our modern society. Explore further resources and embrace the challenge of delving into this fascinating realm of electrical engineering. The insights you gain will be invaluable in navigating the complexities of power systems and contributing to a more electrified future. So, grab a pencil, sketch a phasor, and embark on your journey to unraveling the mysteries of three-phase power.
Understanding non mi avete fatto niente lyrics meaning and impact
Need duplicate documents fast find carbon copy printing near you
Decoding condenser water pump costs get the best deal
three phase power phasor diagram | Innovate Stamford Now

Three Phase Star Connection Y Three Phase PowerVoltageCurrent | Innovate Stamford Now

three phase power phasor diagram | Innovate Stamford Now

Determining Phase And Line Voltages And Currents In 46 OFF | Innovate Stamford Now

Phasor Diagram 3 Phase Ac Circuit | Innovate Stamford Now

Equivalent Circuit Diagram Of Induction Motor | Innovate Stamford Now

How To Draw A Phasor Diagram For 3 | Innovate Stamford Now

For a purely inductive ac circuit show that the current lags the | Innovate Stamford Now

Phasor Representation Of One Phase AC Circuit Presentation | Innovate Stamford Now

Open Delta Transformer Connection | Innovate Stamford Now
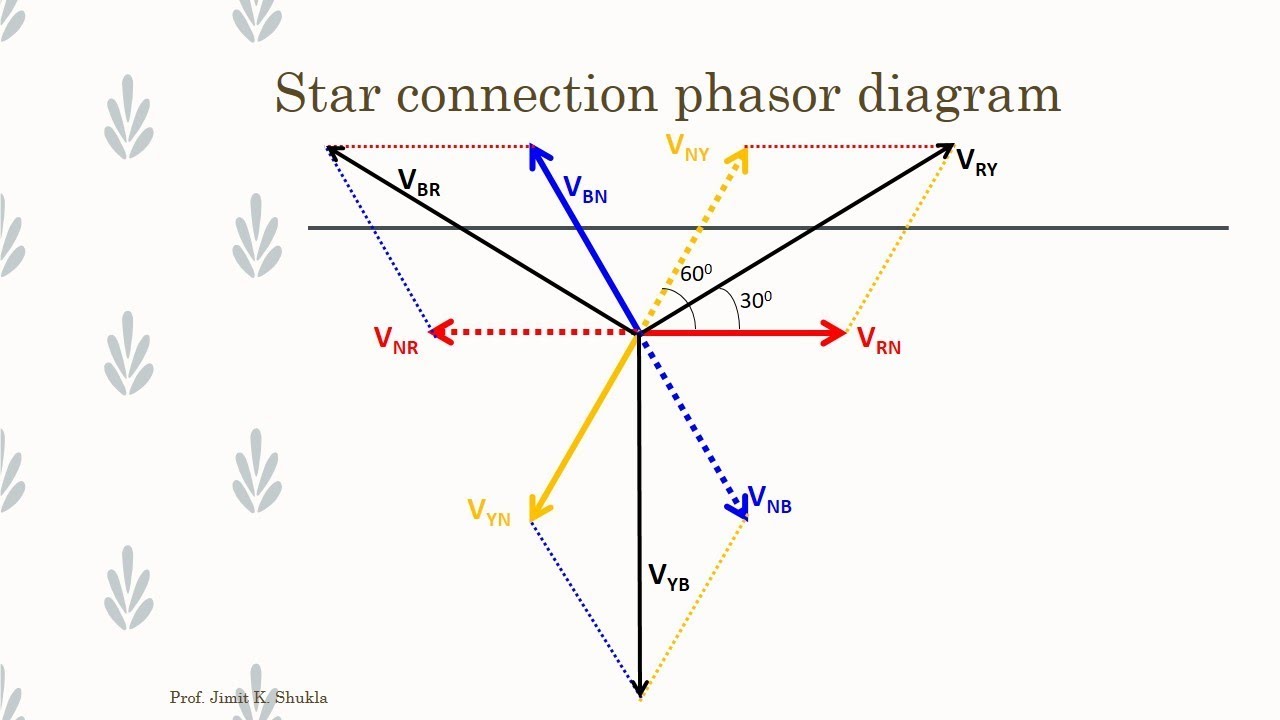
DIAGRAM Single Phase Phasor Diagram | Innovate Stamford Now
Phasor Diagram Of Capacitor In Ac Circuit | Innovate Stamford Now

Delta Three Phase Connection | Innovate Stamford Now

Power Factor Phasor Diagram | Innovate Stamford Now

Three Phase Delta Connection Three Phase PowerVoltageCurrent | Innovate Stamford Now